Going on with your business without understanding what is going on with your business is the biggest gamble of your life. In order to make proper business decisions, understanding the insights is key!
Fundamentals of Orders Insight
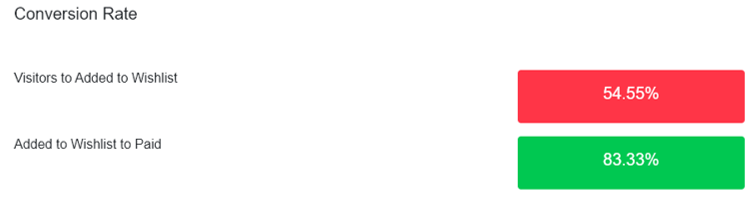
Conversion rate
There are two options here,
Visitors to Added Wishlist: This means how many people out of every hundred have added a product to cart after visiting your shop. This being 20% means every 1 in 5 people who have visited your shop have added a product to cart.
Added to wish list to paid: This one means how many orders out of every hundred have been confirmed after being adding to cart. This being 20% means every 1 in 5 orders that have been added to cart have been confirmed.
The higher these rates are, the better it is for your business.
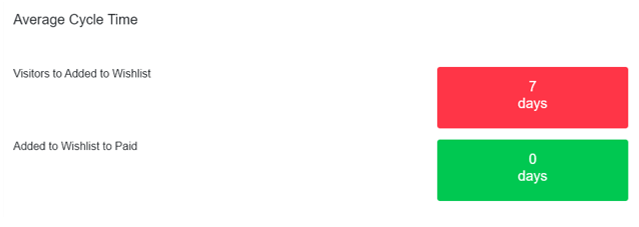
Average cycle of conversion rate
This shows the average time for a order to go from visitor stage to add to cart and the average time to go from add to cart to paid.
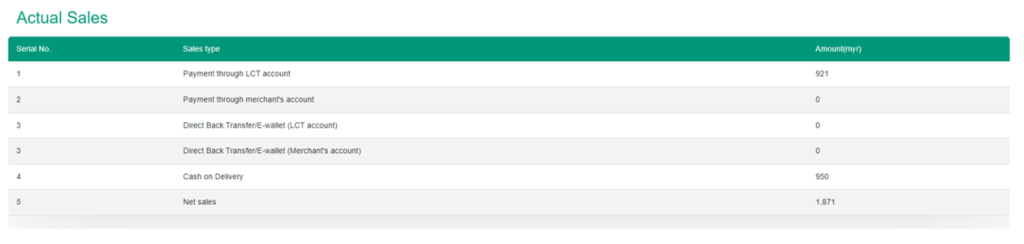
Actual Sales
This one shows the actual number of sales shown by sales type. In what ways people have paid will be shown along with their numbers.
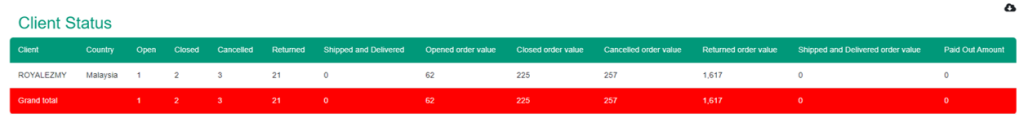
Client Status
This part shows where in the customer journey all the customers are by client.
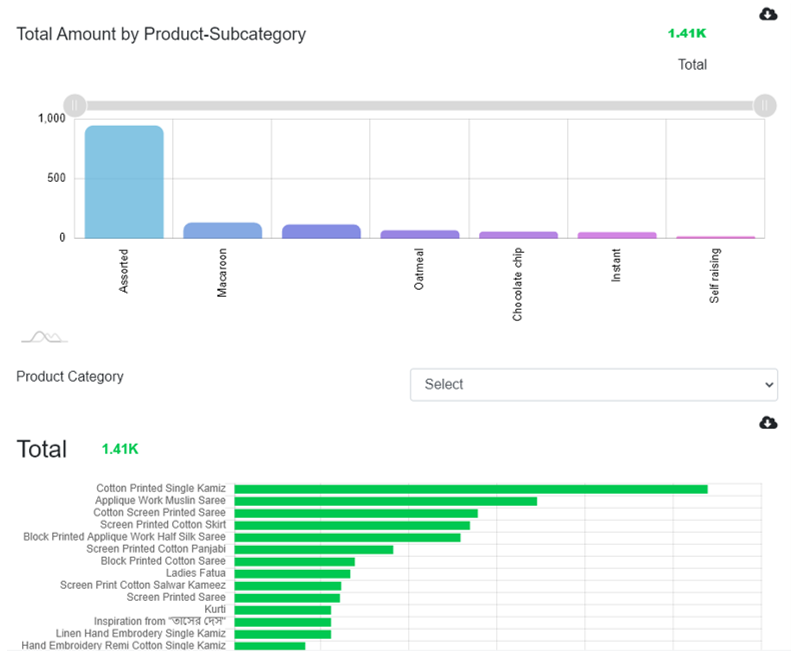
Total Amount by Product – Subcategory
Here you can see how many sales you have made by product sub category. Highest to lowest is shown from left to right. Below, you can select a category and see sales for that category.
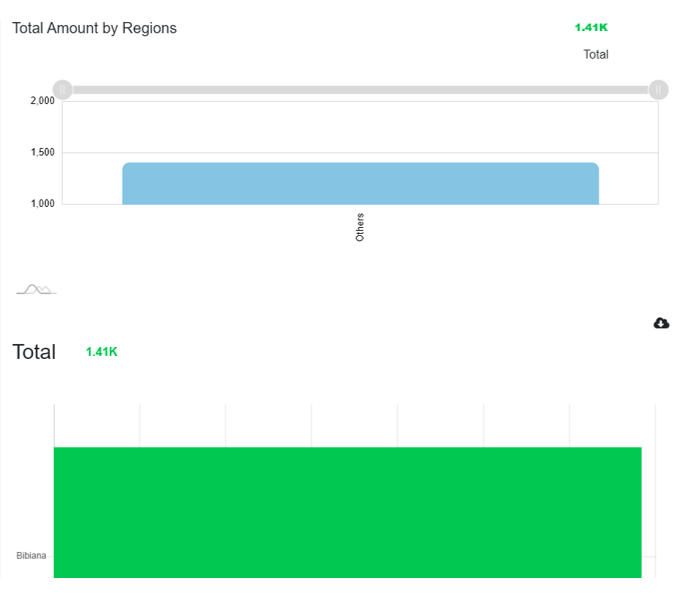
Total amount by region
Here you can see total sales by regions.
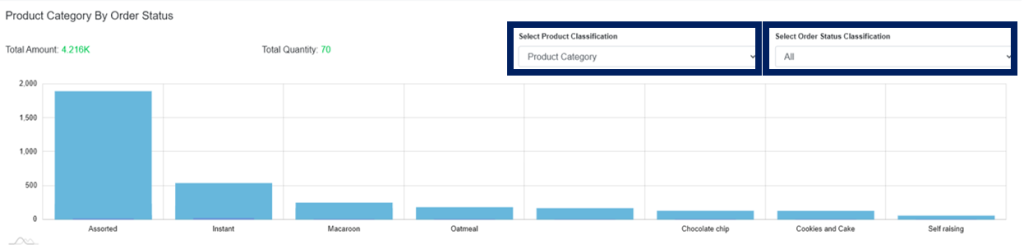
Product Category by Order Status
Here you can see your product category by order status. You can select product category and select order status classification.
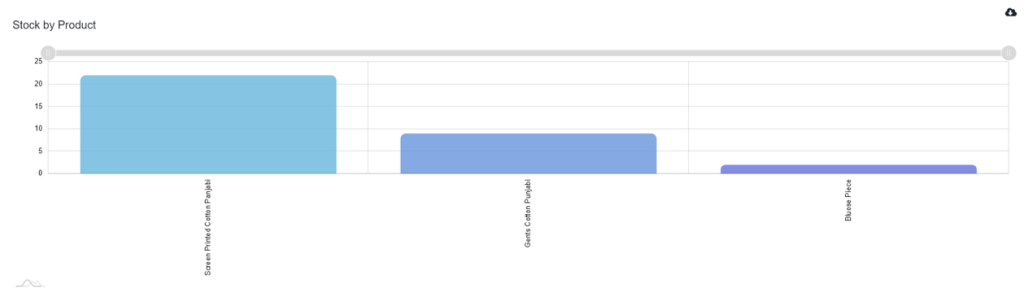
Stock by Product
Here you can see the stock of each available products