Understanding Insights of Businesses Lead and Follow Up
Going on with your business without understanding what is going on with your business is the biggest gamble of your life. In order to make proper business decisions, understanding the insights is key!
Insight basics
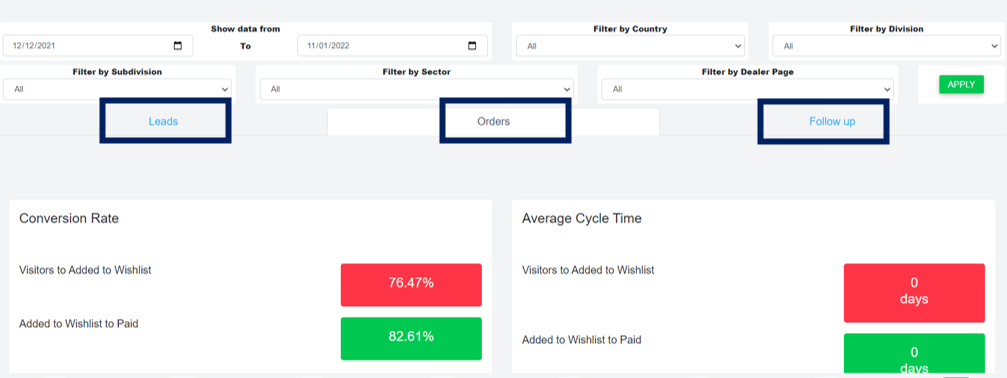
The insights page preview looks like the one below. You can filter the data to see from a specific date to another, by country, by division, by subdivision, by sector, by dealer page. Then there are three options in which you can see the insights. These are leads, orders and Follow Up.
Leads Insight
In the leads insight option, you will see several insight that are related to your leads. One by one is explained below
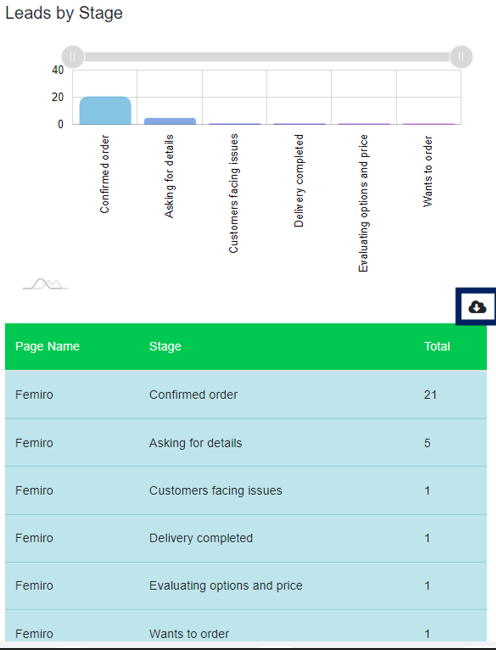
Leads by Stage
Here you can see how many customers you have and in which stage of their journey. This is first shown in a graphical representation and below there is table that explains it. You can download these data in an excel spreadsheet by clicking in the black download icon highlighted in the picture
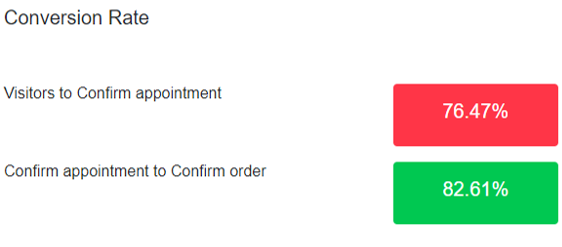
Conversion Rate
There are two options here,
Visitors to Confirm appointment: This means how many people out of every hundred have confirmed appointment after visiting your shop.
Confirm appointment to Confirm order: This one means how many people out of every hundred have confirmed order after adding a product to your cart. This being 20% means every 1 in 5 people who have added a product to your cart have confirmed order.
The higher these rates, the better it is for your business. These are relevant to businesses that have an appointment option, otherwise it will not be.
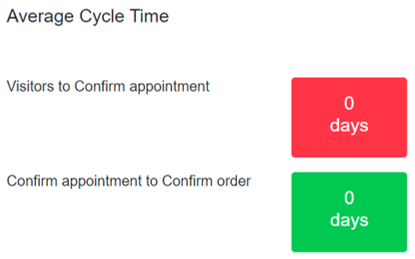
Average cycle time
This is the average time for a visitor to add product to his cart and the average time for a customer who have added to cart to confirm order.
The less the number of days, the better for you. Your target is to lower this number always
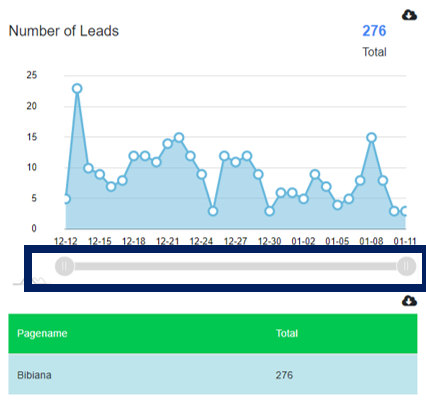
Number of leads
In this section, you can see the number of leads in your business over the time, you can use the bar highlighted to adjust the time. You can also see the total number of leads at the top right.
Number of leads
In this section, you can see the number of leads in your business over the time, you can use the bar highlighted to adjust the time. You can also see the total number of leads at the top right.
Number of leads
In this section, you can see the number of leads in your business over the time, you can use the bar highlighted to adjust the time. You can also see the total number of leads at the top right.
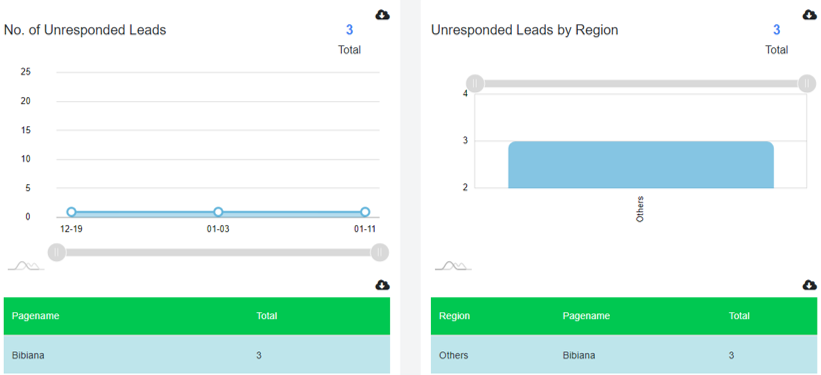
Number of Unresponded leads
(total and by region)
These two shows how many leads of your business have not yet been responded to. The first one shows total and the second one shows it by region.
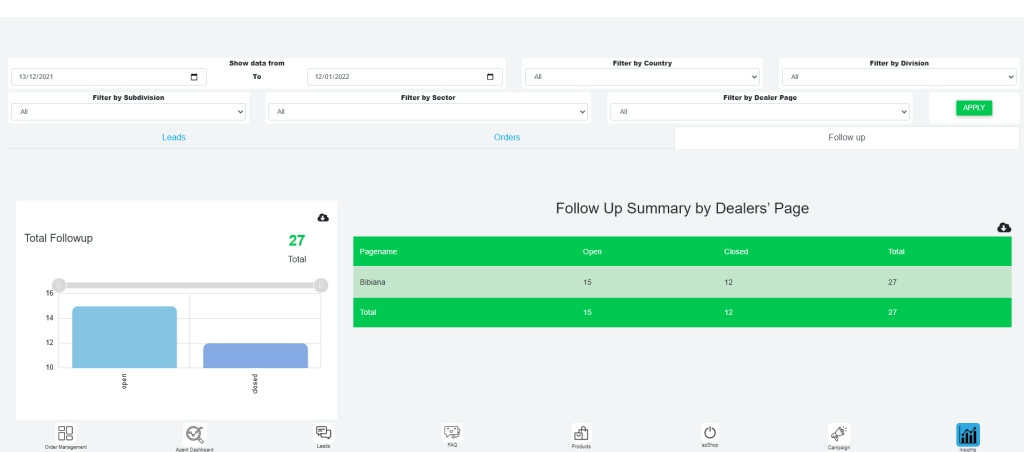
Follow Up Insight
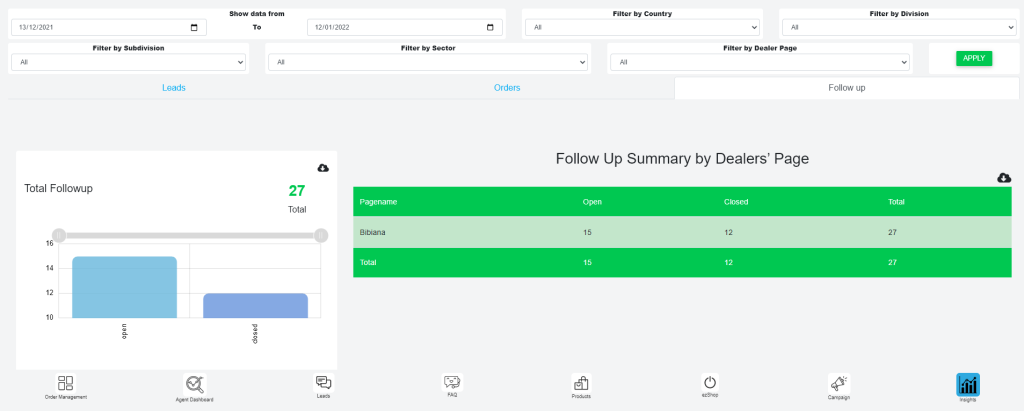
The Follow Up Insight page preview looks like the picture below. You can filter it above using the options from before. After that, you can see the insights in various “Follow up” specific way.
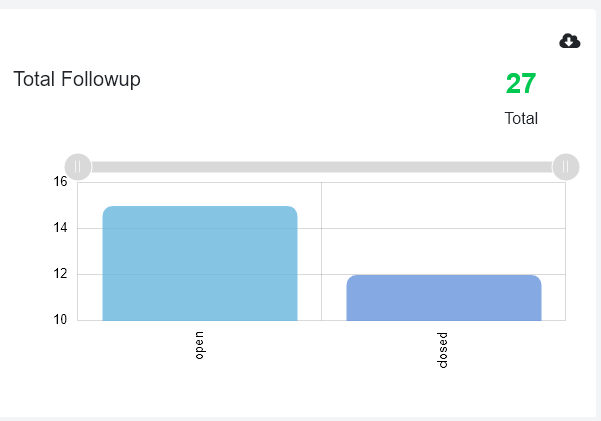
Total Follow Up
This section shows how many total follow up has been opened and how many have been closed in a graphical way.
Follow Up Summary by Dealers page
This section shows how many total follow up has been opened and how many have been closed in a graphical way.
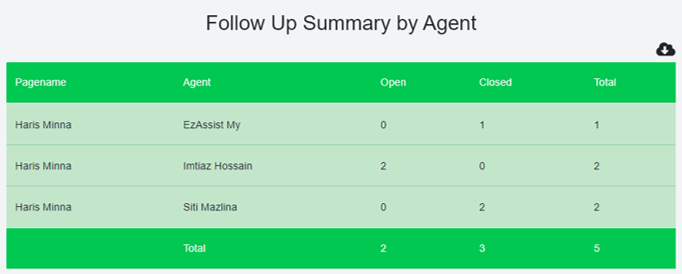
Follow Up Summary by Agent
Here you can see which of your employees have been assigned
a follow up and who have closed how many follow ups till now.
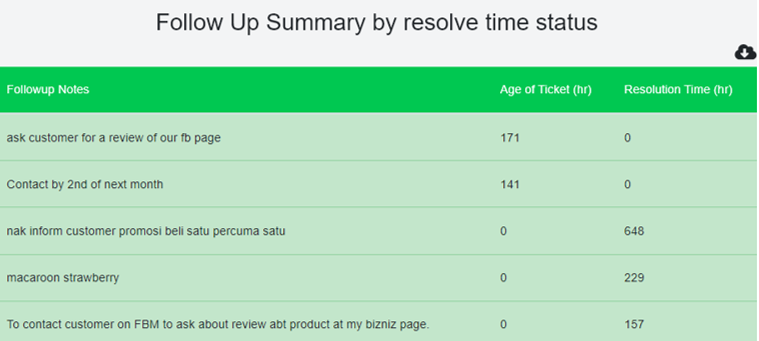
Follow Up Summary by Resolve Time Status
Here you can see the follow up notes, the time against the notes and how long it took to resolve that.